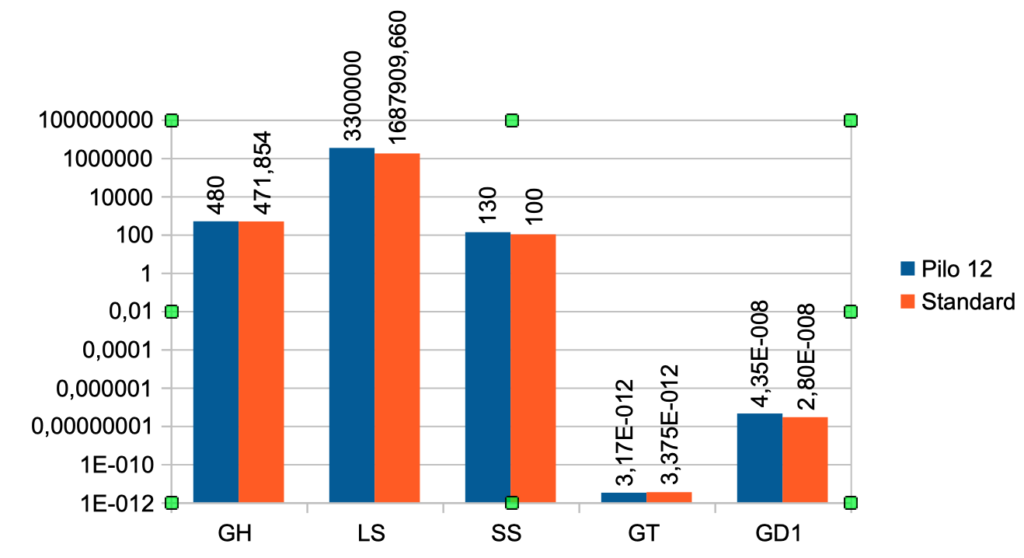
Pilo (1) and Kobuta (2) are different scenarios and here we have looked into TSH, FT3 and FT4 from the Simthyr model.
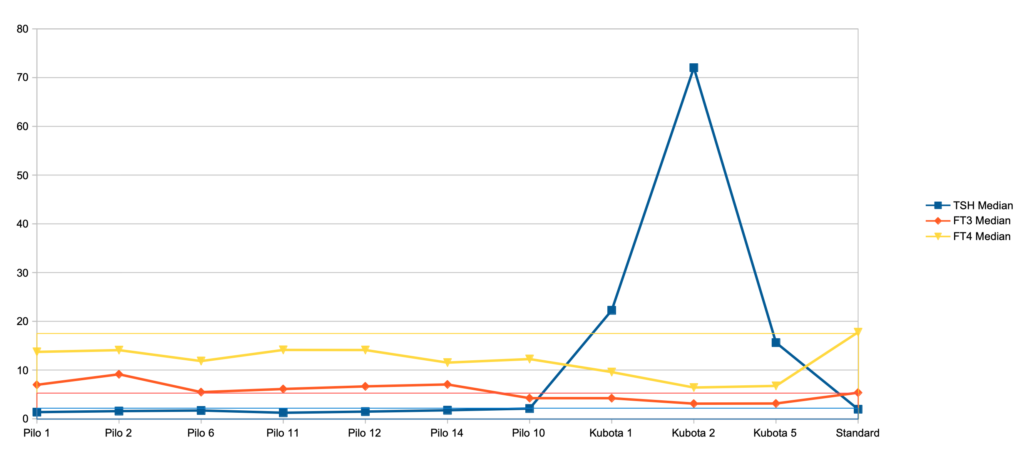
Below you find the description of the Pilo scenarios (The Kubota scenarios will follow later in the text) – The last entry is the figures for the standard scenario in SimThyr:
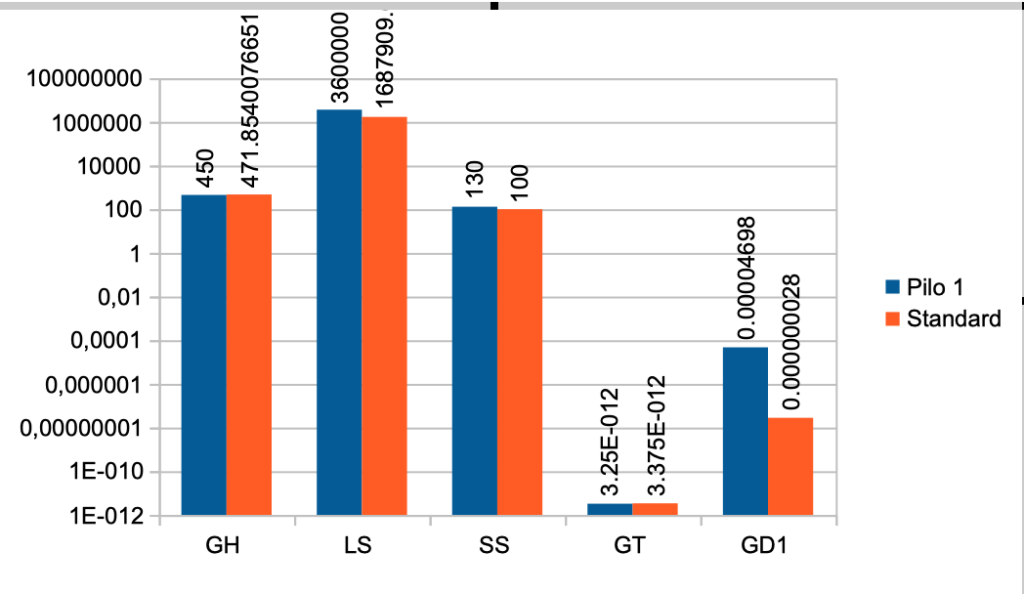
| Case No. 1 from Pilo et al. showing slight hyperdeiodination and high conversion rate The FT3 value is 6,97 a little higher than the standard value (5,36) The FT4 value is lower than the standard value (17,76) – Pilo 1 (13,72) The TSH value is 1,36 and the standard value is 1,96 Pilo 1 GH < (lower than) standard. See the effect of GH here Pilo 1 LS > (higher than) standard. See the effect of LS here Pilo 1 SS > standard. See the effect of SS here Pilo 1 GT < standard. See the effect of GT here Pilo 1 GD1 > standard. See the effect of GD1 here (Diagram) |
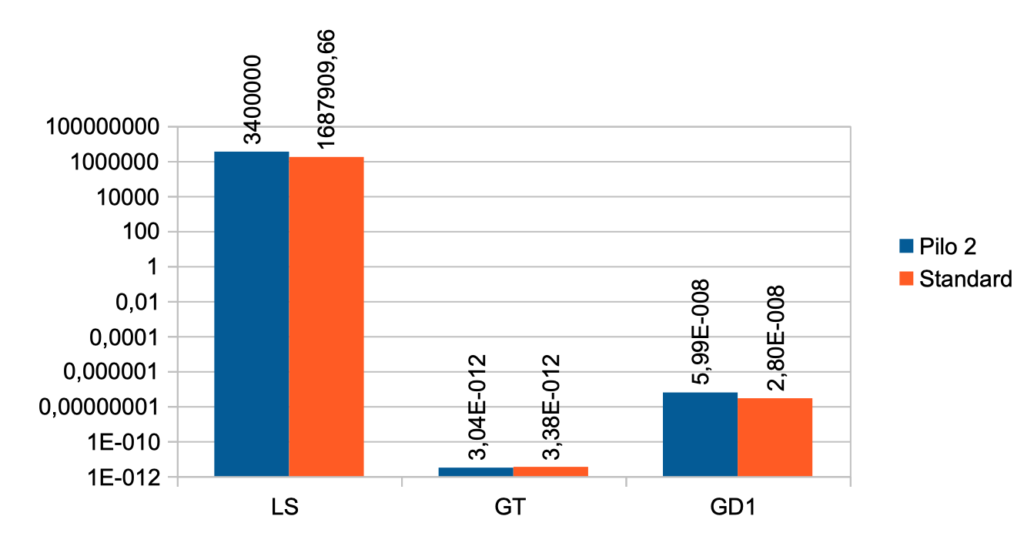
| Case No. 2 from Pilo et al. showing slight hyperdeiodination The FT3 value is 9,13 a little higher than the standard value (5,36) The FT4 value is lower than the standard value (17,76) – Pilo 2 (14,08) The TSH value is 1,57 and the standard value is 1,96 Pilo 2 LS > standard. See the effect of LS here Pilo 2 GT < standard. See the effect of GT here Pilo 2 GD1 > standard. See the effect of GD1 here (Diagram) |
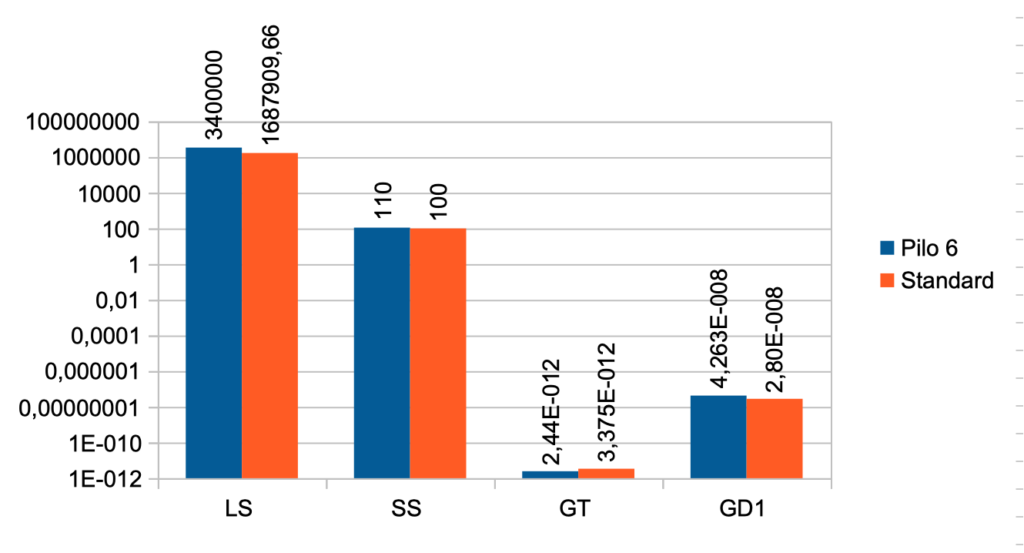
| Case No. 6 from Pilo et al. with low secretion rate for T4 The FT3 value is 5,46 a little higher than the standard value (5,36) The FT4 value is lower than the standard value (17,76) – Pilo 6 (11,84) The TSH value is 1,70 and the standard value is 1,96 Pilo 6 LS > (higher than) standard. See the effect of LS here Pilo 6 SS > standard. See the effect of SS here Pilo 6 GT < standard. See the effect of GT here Pilo 6 GD1 > standard. See the effect of GD1 here (Diagram) |
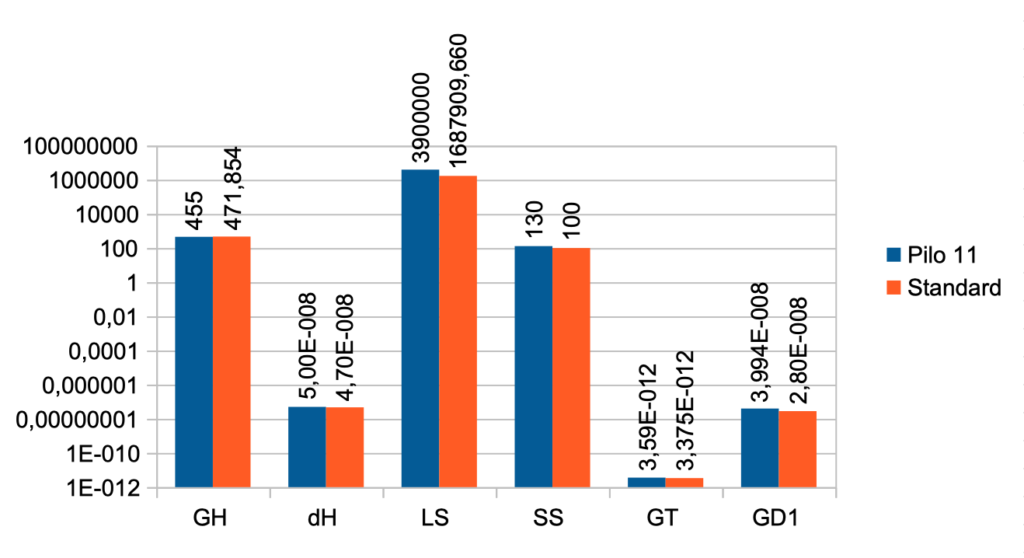
| Case No. 11 from Pilo et al. with high secretion rate for T4 The FT3 value is 6,11 a little higher than the standard value (5,36) The FT4 value is lower than the standard value (17,76) – Pilo 11 (11,84) The TSH value is 1,23 and the standard value is 1,96 Pilo 11 GH < standard. See the effect of GH here Pilo 11 dH < standard. See the effect of GH here Pilo 11 LS > standard. See the effect of LS here Pilo 11 SS > standard. See the effect of SS here Pilo 11 GT < standard. See the effect of GT here Pilo 11 GD1 > standard. See the effect of GD1 here (Diagram) |
| Case No. 12 from Pilo et al. with high production rate for T3 The FT3 value is 6,64 a little higher than the standard value (5,36) The FT4 value is lower than the standard value (17,76) – Pilo 12 (14,1) The TSH value is 1,47 and the standard value is 1,96 Pilo 12 GH < standard. See the effect of GH here Pilo 12 LS > standard. See the effect of LS here Pilo 12 SS > standard. See the effect of SS here Pilo 12 GT < standard. See the effect of GT here Pilo 12 GD1 > standard. See the effect of GD1 here (Diagram) |
| Case No. 14 from Pilo et al. with low production rate for T3 Coming soon |
| Case No. 10 from Pilo et al. with normal values for SPINA-GT and SPINA-GD |
| Case No. 1 from Kubota et al. showing latent (subclinical) hypothyroidism |
| Case No. 2 from Kubota et al. showing overt hypothyroidism |
| Case No. 5 from Kubota et al. showing overt hypothyroidism |
Look hypophyseal secretory capacity (GH) up – LINK
- Pilo A, Iervasi G, Vitek F, Ferdeghini M, Cazzuola F, Bianchi R. Thyroidal and peripheral production of 3,5,3′-triiodothyronine in humans by multicompartmental analysis. Am J Physiol. 1990 Apr;258(4 Pt 1):E715-26. PubMed PMID: 2333963.
- Kubota S, Fujiwara M, Hagiwara H, Tsujimoto N, Takata K, Kudo T, Nishihara E, Ito M, Amino N, Miyauchi A. Multiple thyroid cysts may be a cause of hypothyroidism in patients with relatively high iodine intake. Thyroid. 2010 Feb;20(2):205-8. doi: 10.1089/t
