While working on this page, I came across a saving opportunity in R – save.image. It was a fantastic possibility till it was not anymore. After opening R and pressing save.image left me with an empty workspace and hours of lost work. Hence this page is not complete yet.
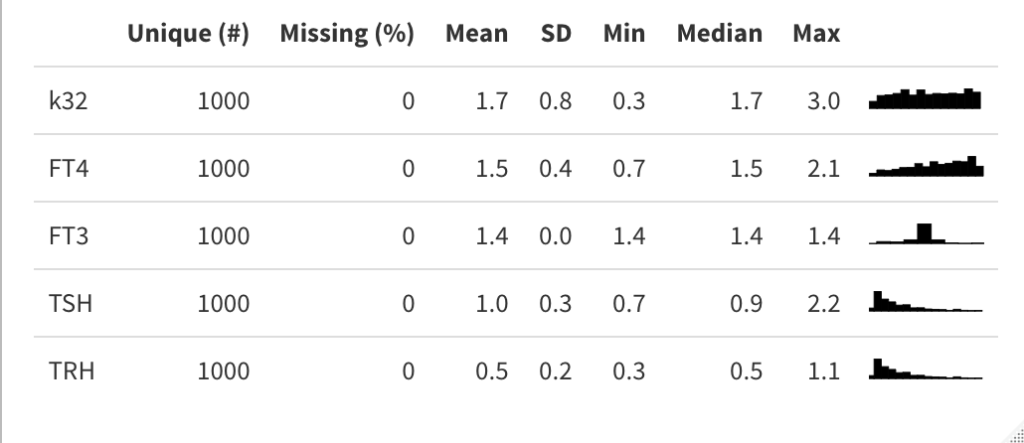
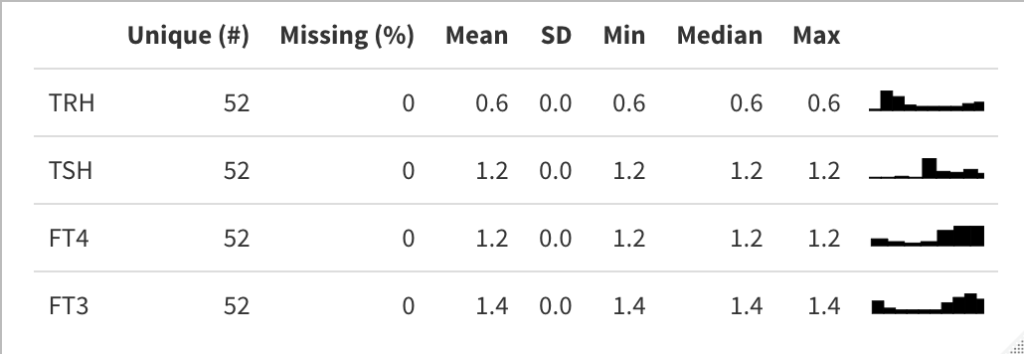
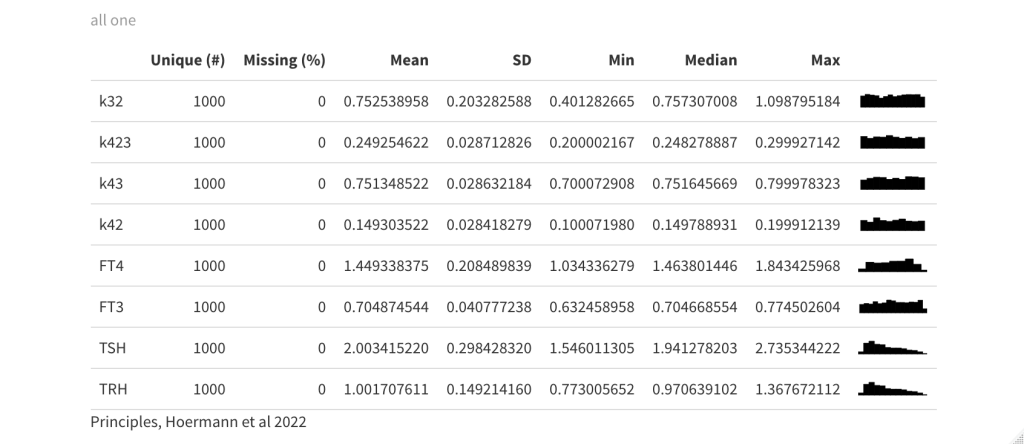
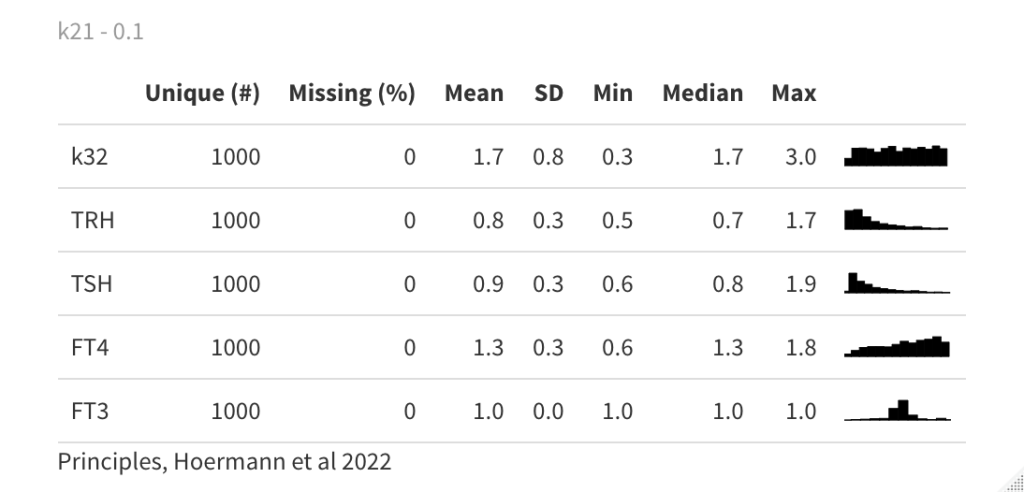
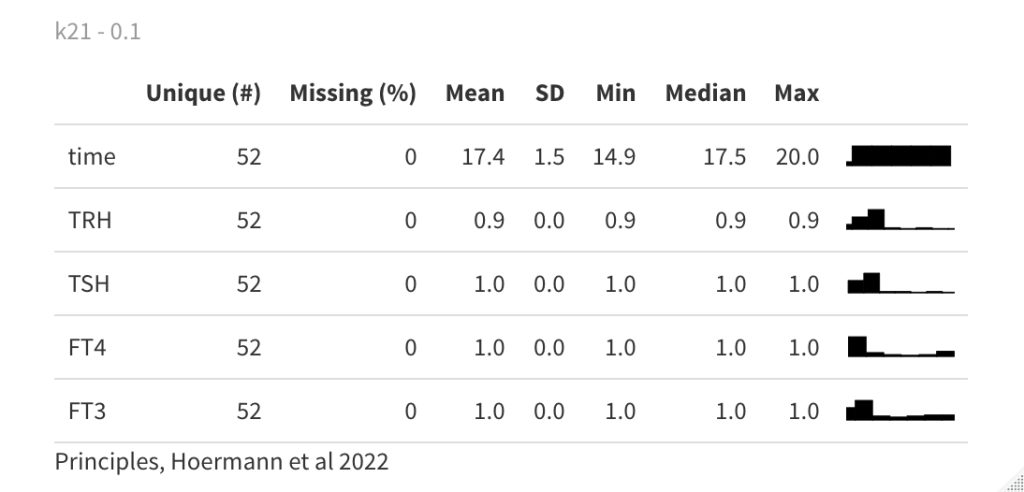
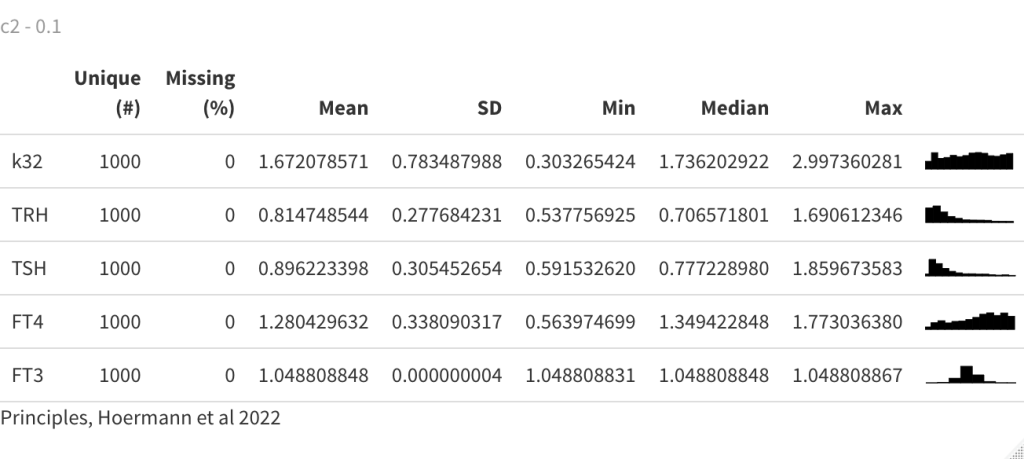
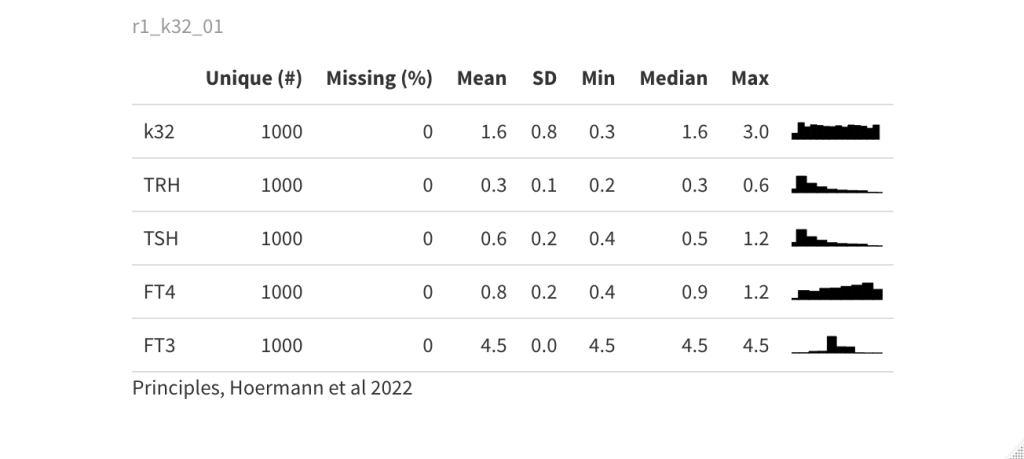
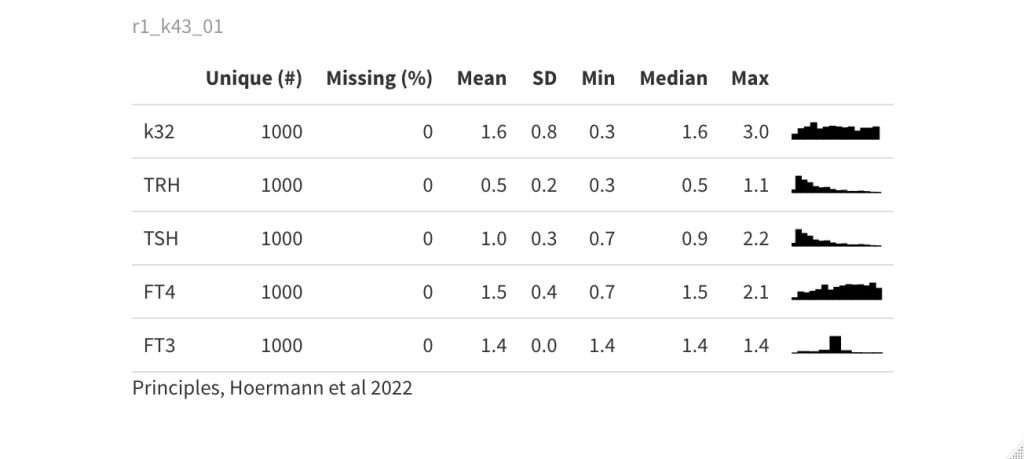
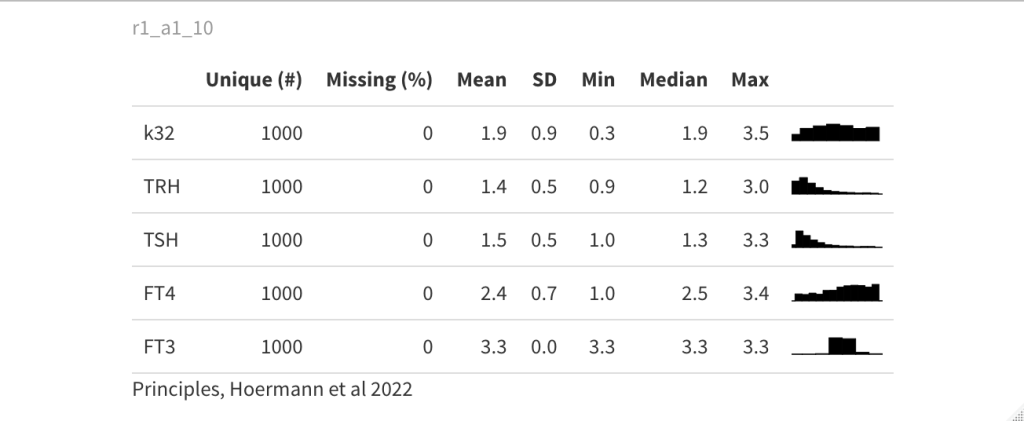
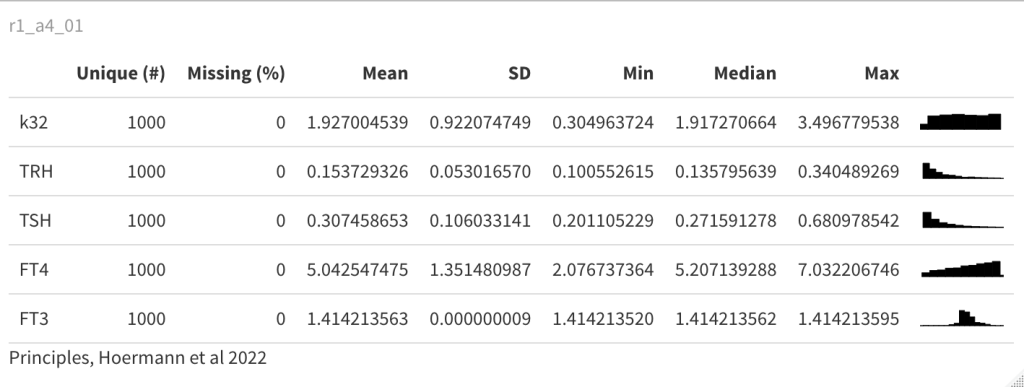
These tables show the complex (theoretical) interplay between the hormones.
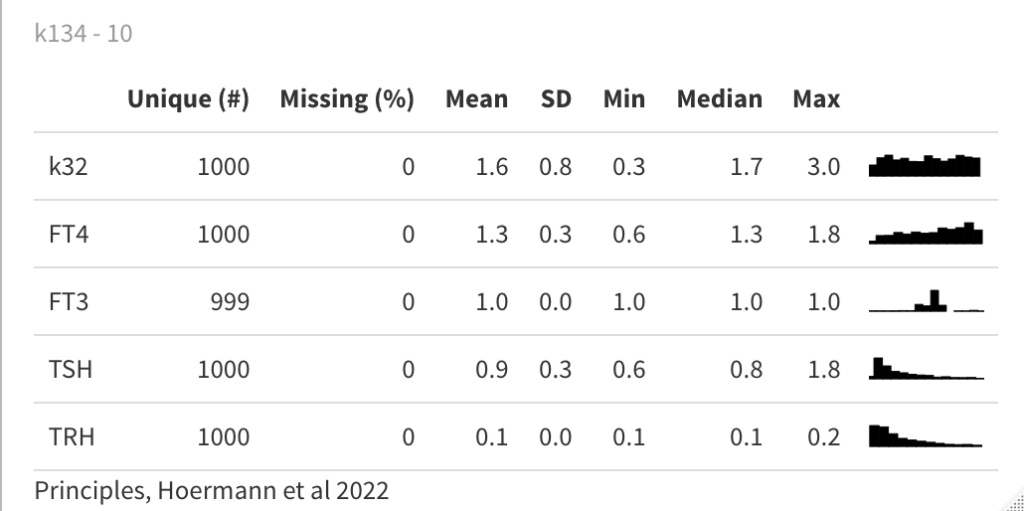
Equilibrium solutions
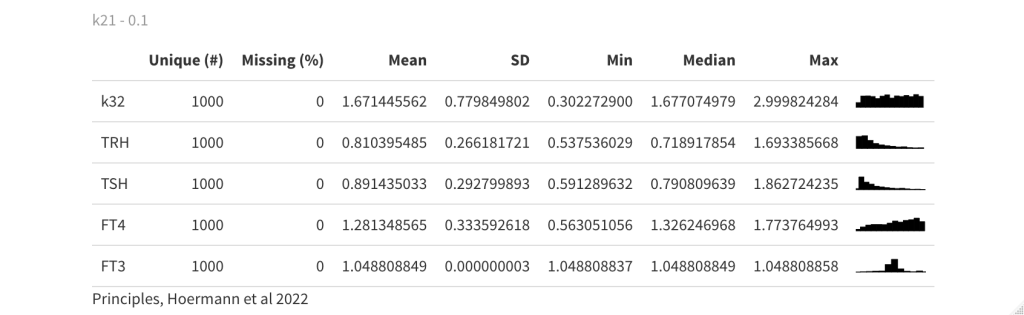
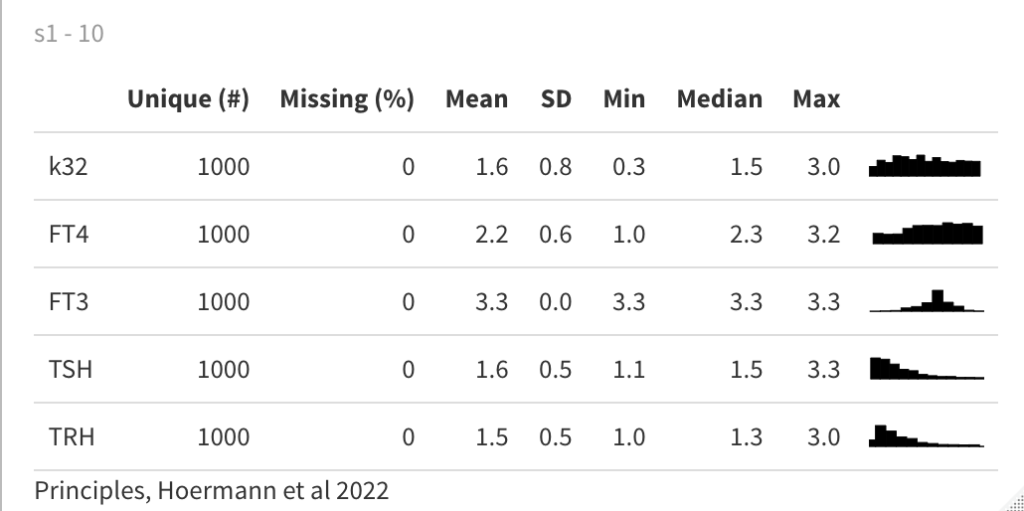
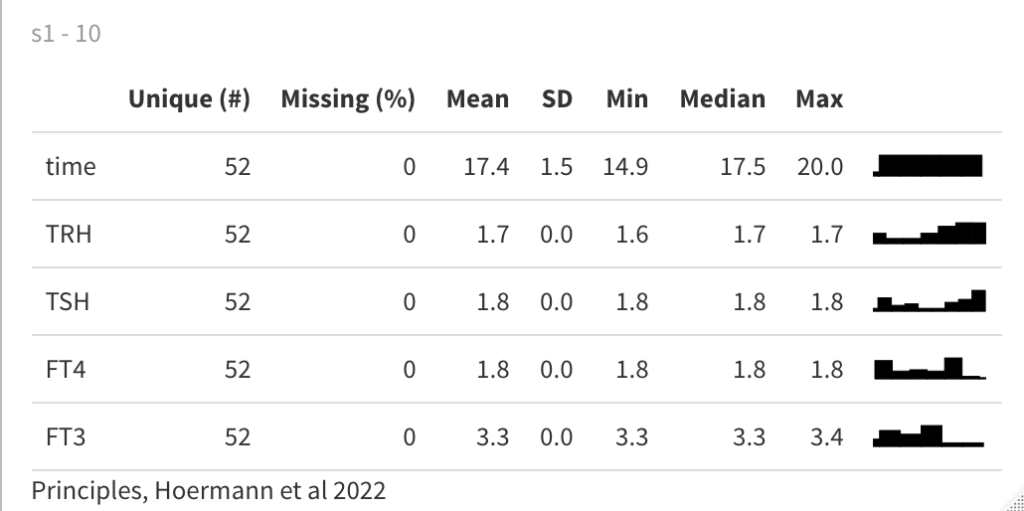
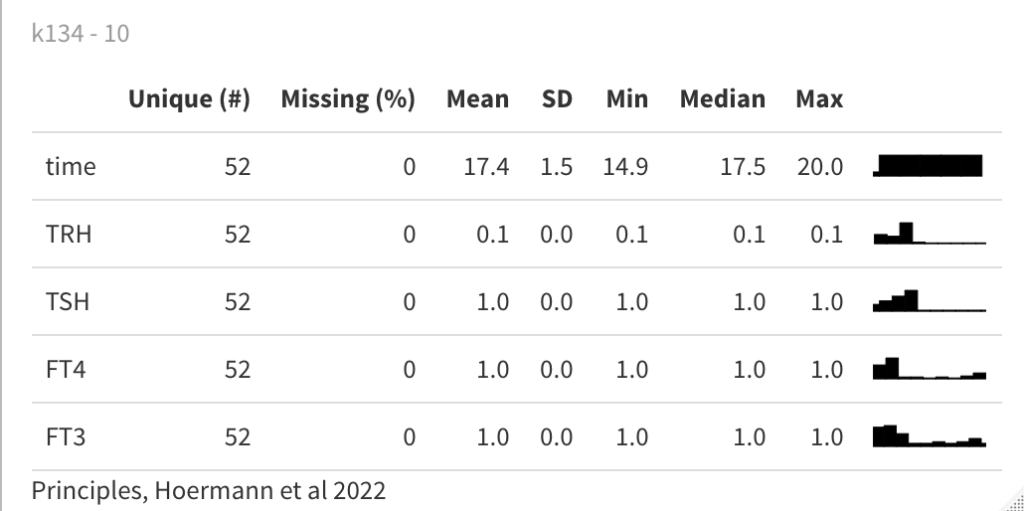
Time-dependent solutions

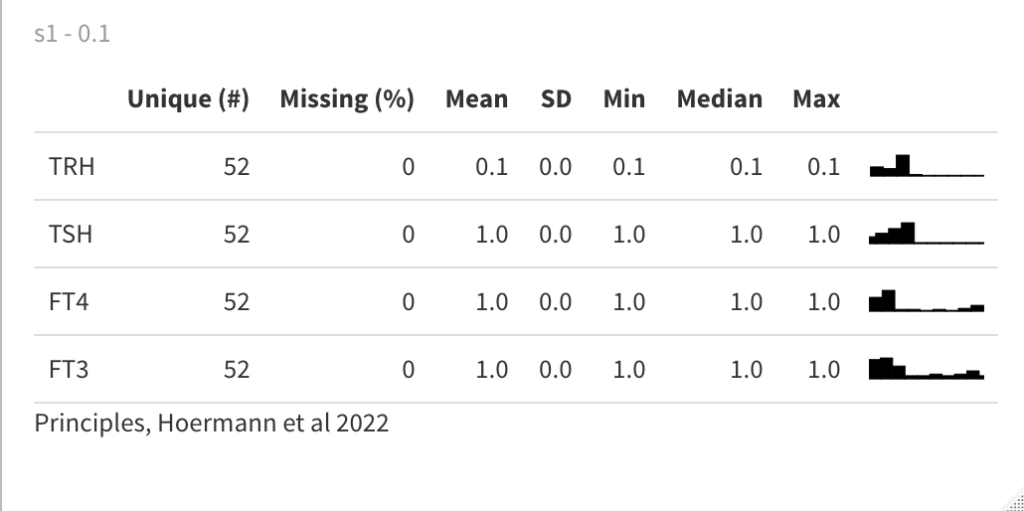
s1/FT3(0.1,1,10) – 1.0, 1.4, 3.3
s1/TSH(0.1,1,10) – 0.9, 1.0, 1.6
s1/TRH(0.1,1,10) – 0.1, 0.5, 1.5
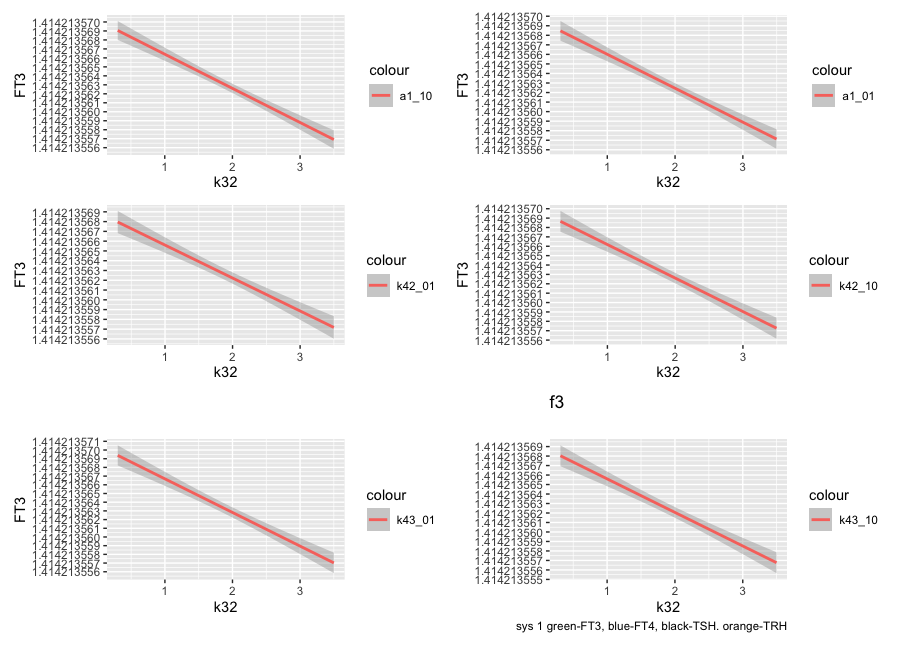
There is still a marginal variation in FT3 all over the range – see the histograms. But it is in the 9th decimal
| s1_10 (analytical equilibrium solutions of system (1)) | |
| TRH | 1.6556002607617 |
| TSH | 1.82116028683787 |
| FT4 | 1.82116028683787 |
| FT3 | 3.3166247903554 |
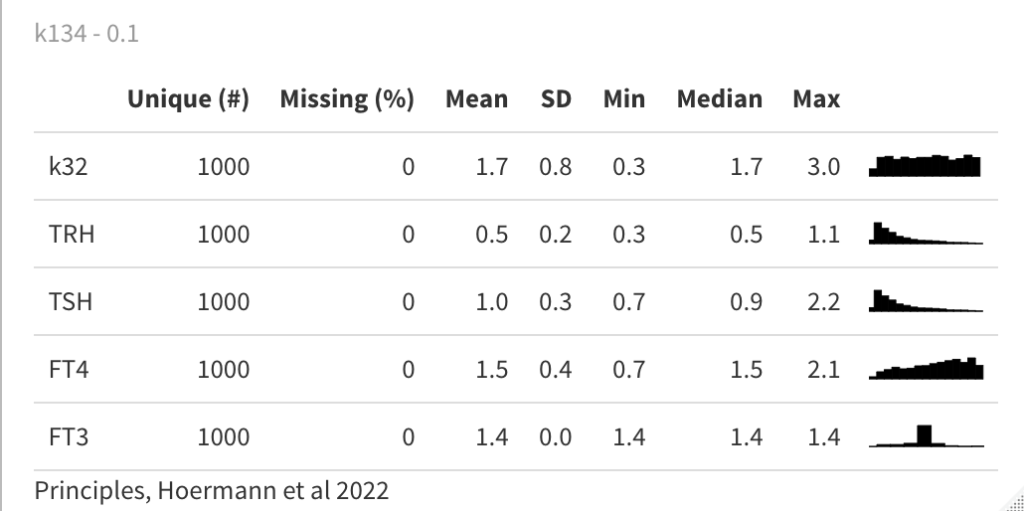
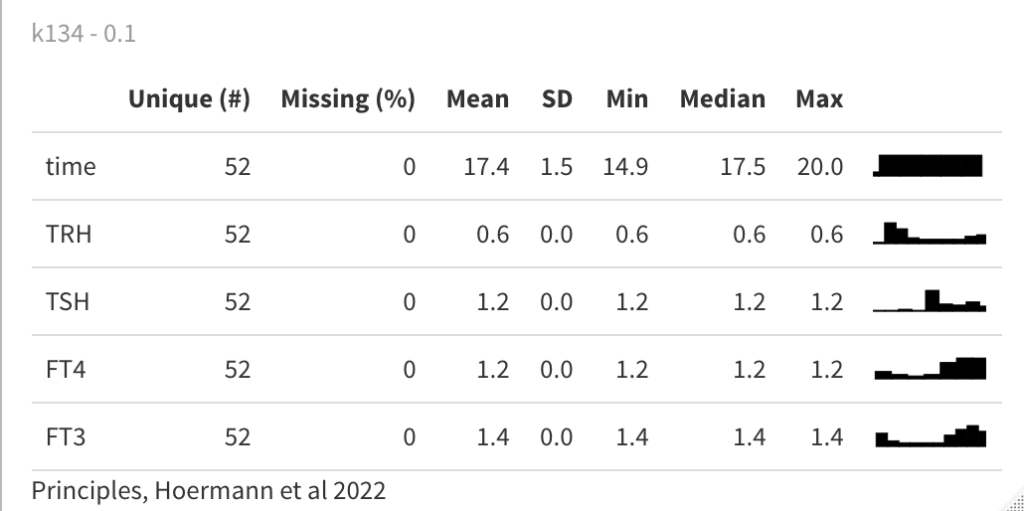
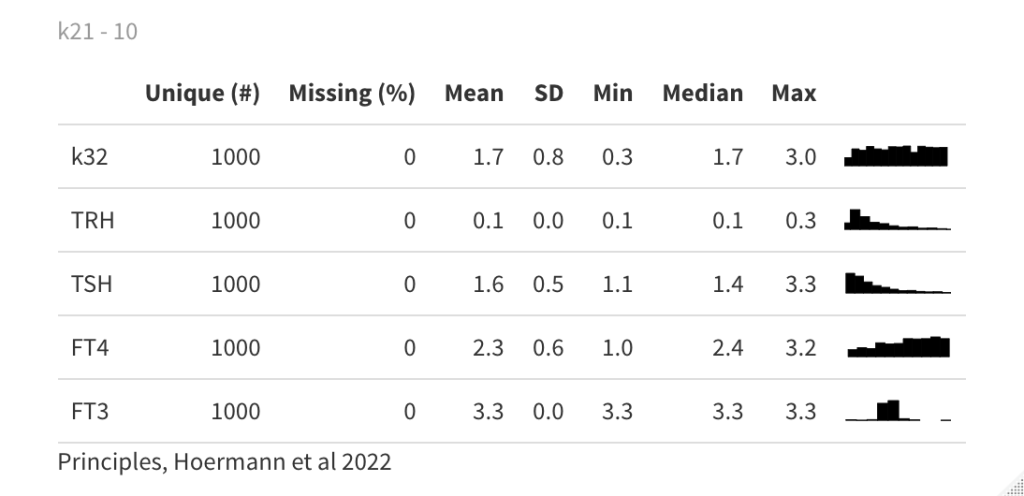
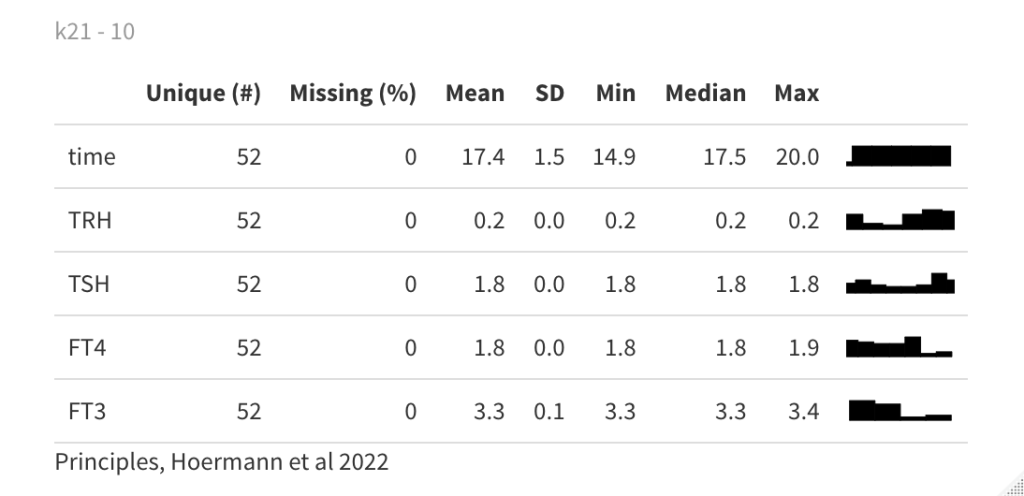
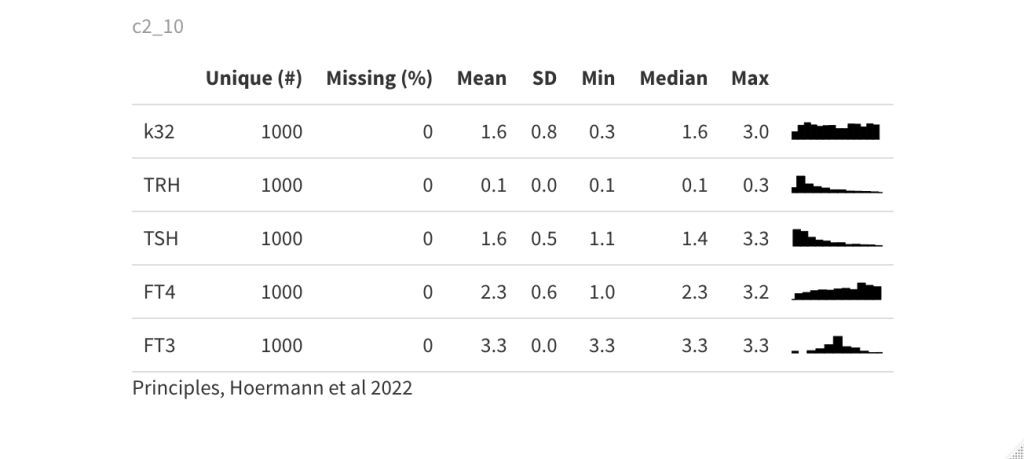
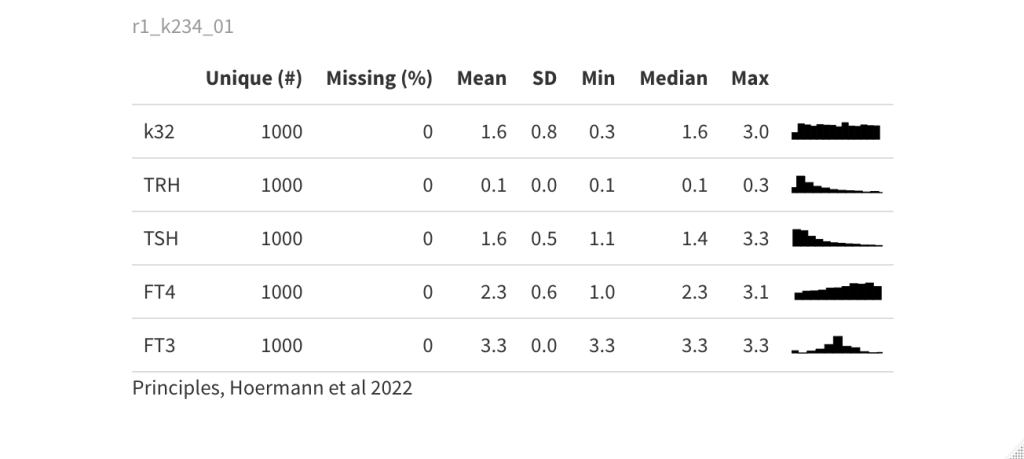
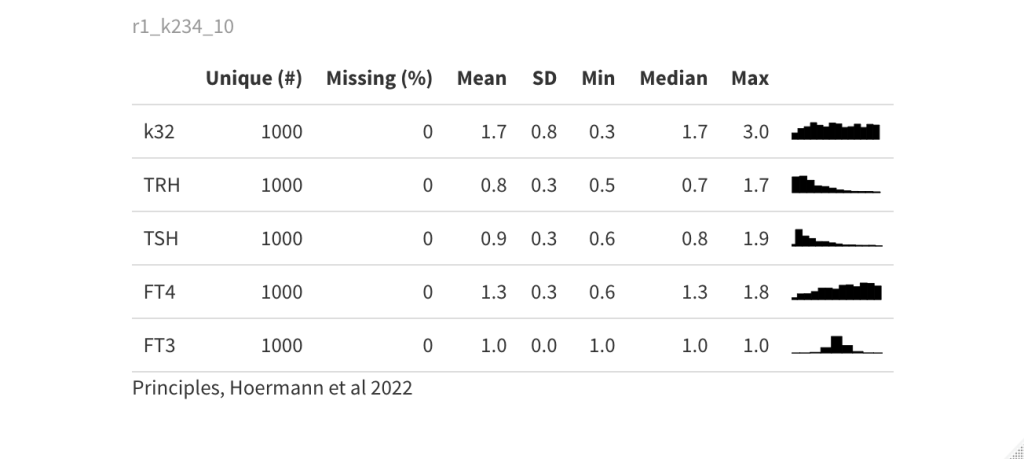


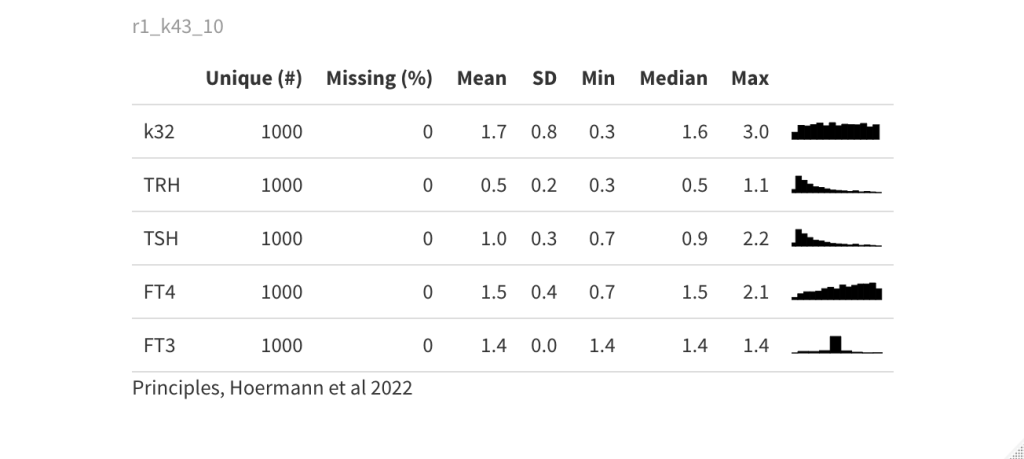
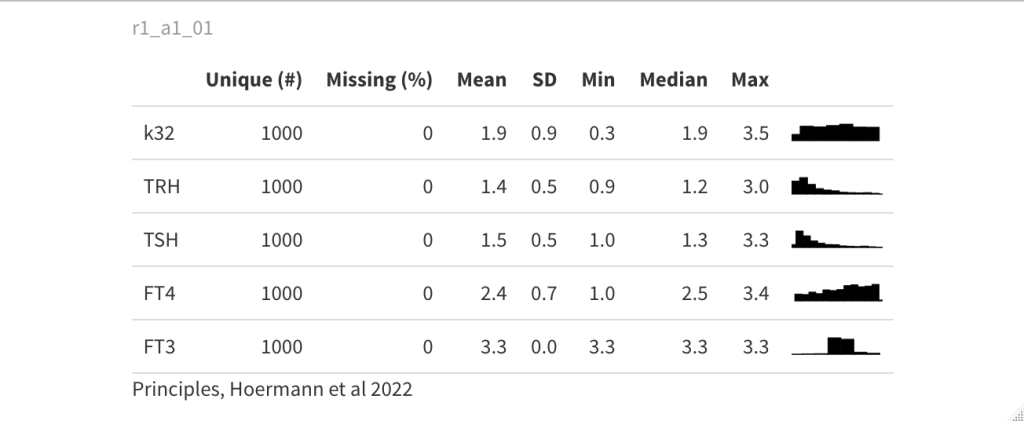
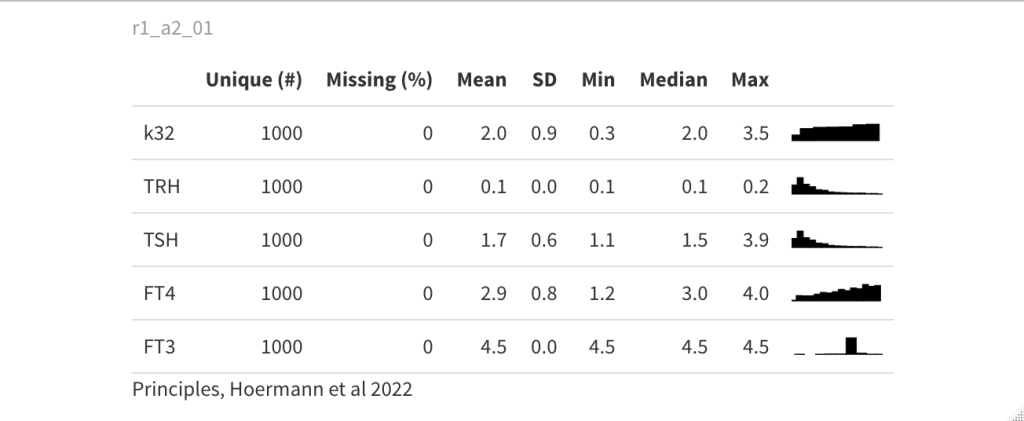
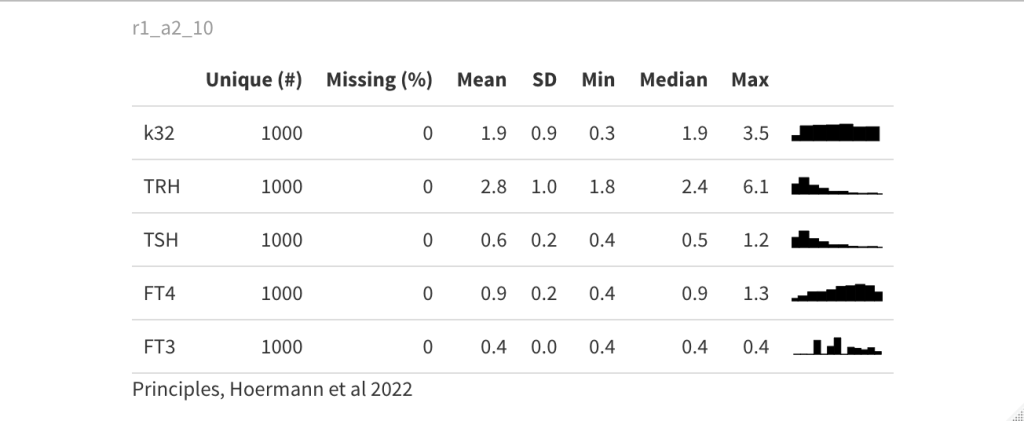
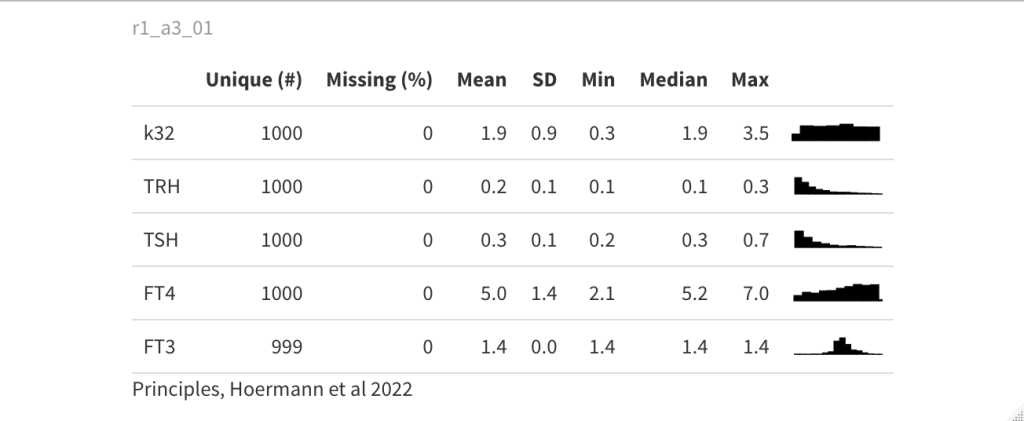

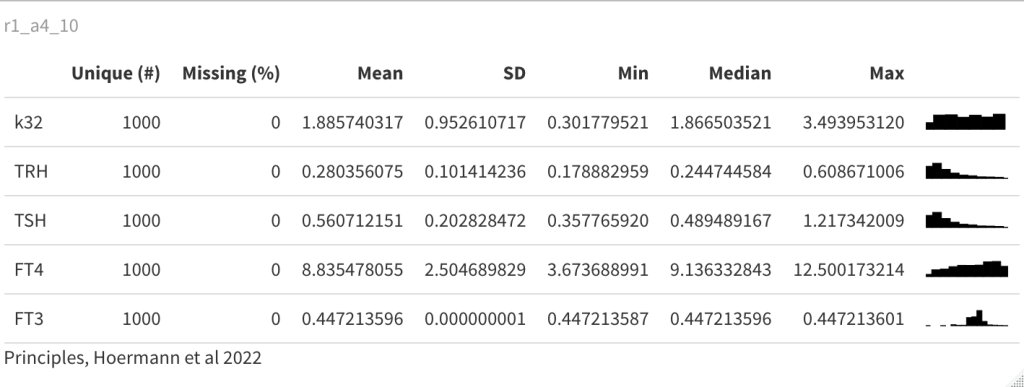
Below are three different parameters 0.1 or 10 – to show the movement experimental not physiological