I have done a little experiment. Subtracted ten and added ten percent to the standard parameters and “surprisingly” it gave the following pattern:
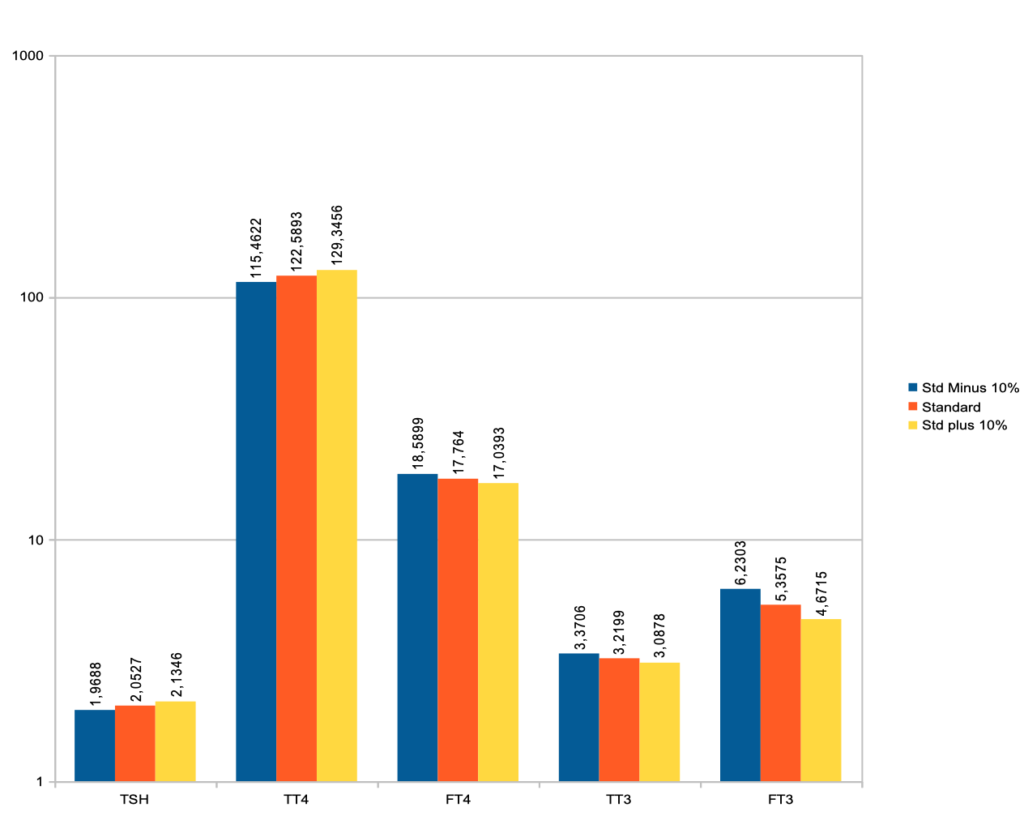
What is obvious from this chart is that there are opposite effects of the parameters on the TSH and the thyroid hormones:
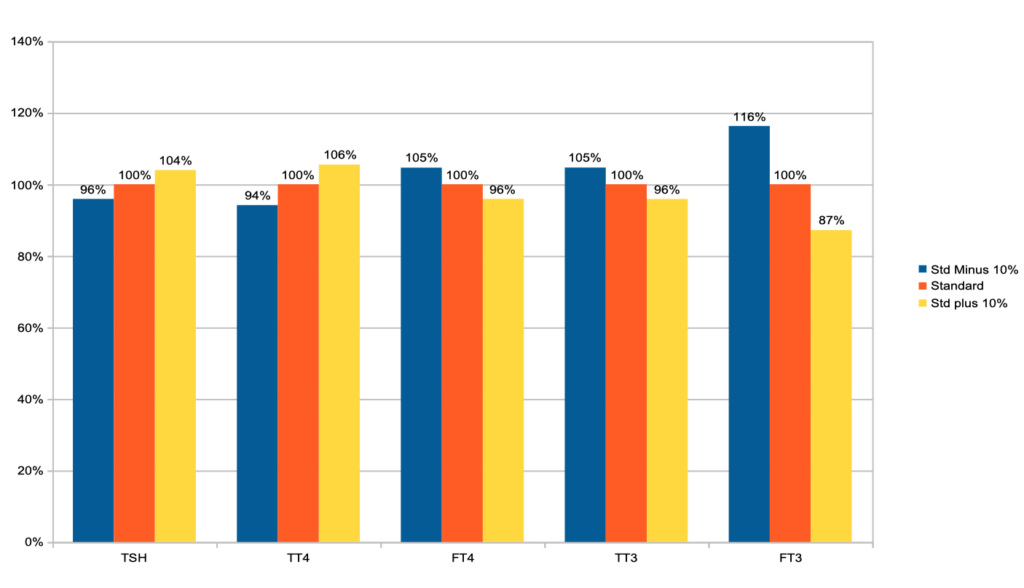
In FT3 there are effects above the ten percent (16% above and 13% below)