GD 1: Sum activity of peripheral type 1 deiodinase (D1)
| TABLE 7. | Decrease GD1 ( /10 ) | STANDARD FIGURES | Increase GD1 (x10) 2.8E-7 |
| TRH | 2500 | 2500 | 2500 |
| TSH | 1.8138 | 1,8 | 1.8138 |
| TT4 | 121.9379 | 121,94 | 121.9379 |
| FT4 | 17.6696 | 17,67 | 17.6696 |
| TT3 | 0.3216 | 3,21 | 32.1575 |
| FT3 | 0.5351 | 5,35 | 53.5067 |
| cT3 | 11693.7408 | 11693,7490 | 11693.7408 |
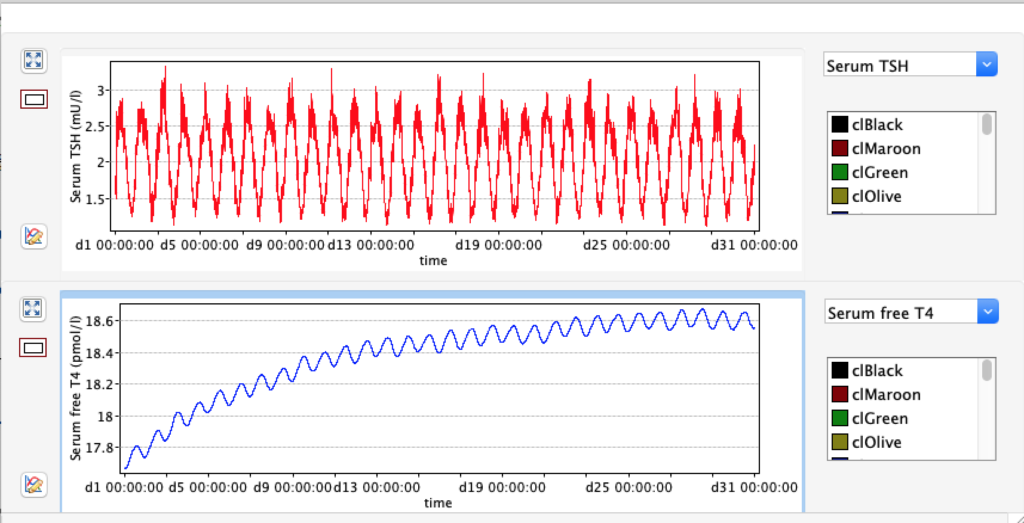
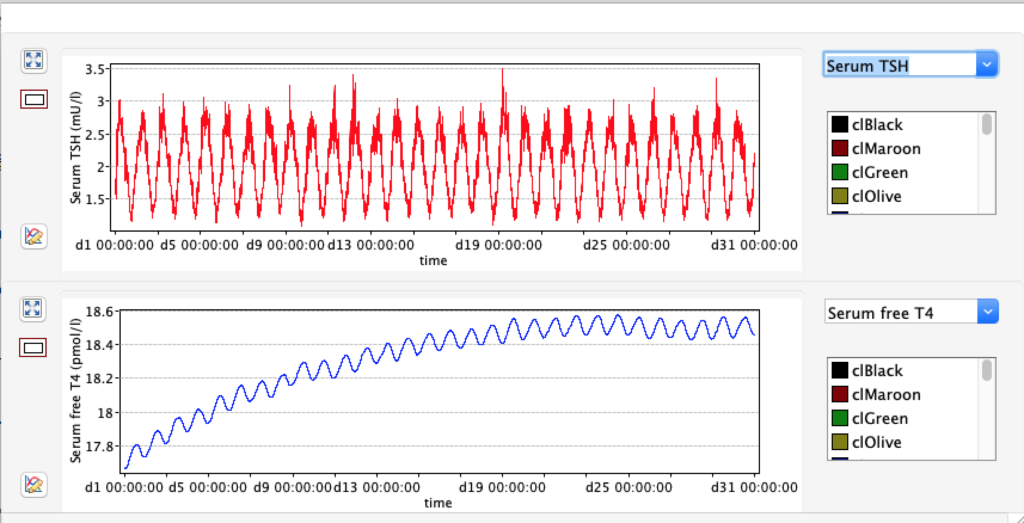
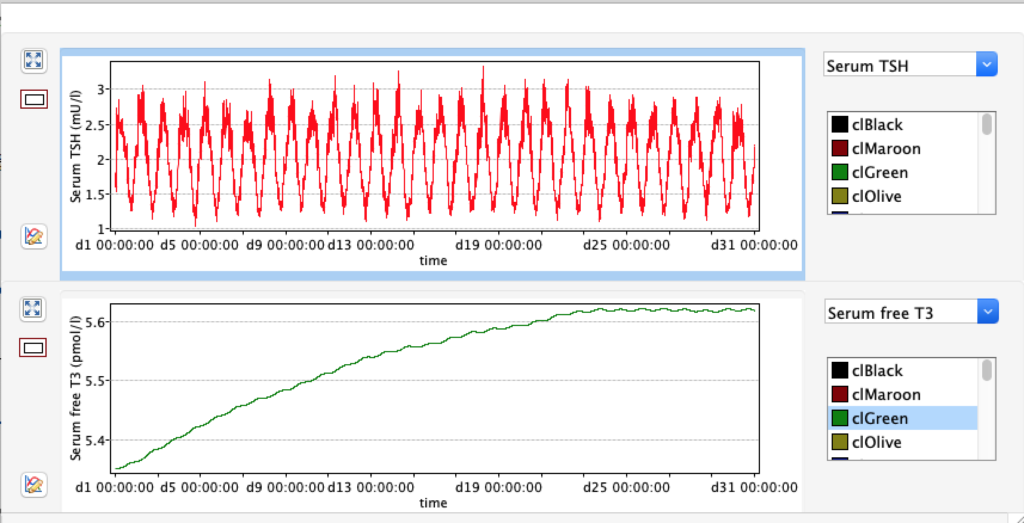
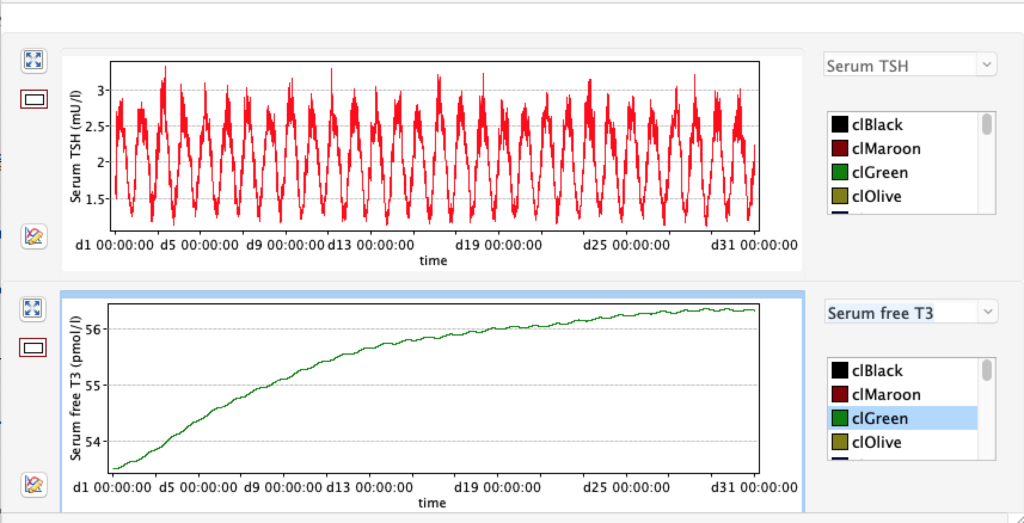
When the sum activity of deiodinase increases we only see changes in the T3 an fT3 parameters.