The thyroid secretes T4 and T3 – and GT is a central parameter in the SimThyr model.
GT has been observed to correlate with thyroid volume as determined by ultrasonography and to be elevated in hyperthyroidism and reduced in hypothyroidism [11, 116].
Recently, a small study that has been published as an abstract revealed calculating GT to be beneficial in differential diagnosis of NTIS with thyrotropic adaptation and latent (subclinical) hyperthyroidism.
This feedback loop might prevent excessively high TSH levels and also be a source of TSH pulsatility, as suggested by investigations based on fractal geometry [49].
The existence of this loop may be a challenge for interpretation of laboratory results, especially in patients with Graves’ disease, where TRAbs may suppress TSH secretion independently from current FT4 levels [50] resulting in TSH levels being lower than expected in relation to current FT4 levels.
GT: the secretory capacity of the thyroid
| TABLE 1. | Decrease GT (3.375E-13) | STANDARD FIGURES | Increase GT (3.375E-11) |
| TRH | 2500 | 2500 | 2500 |
| TSH | 4,9344 | 1,8 | 0,7204 |
| TT4 | 19,7017 | 121,94 | 636,9324 |
| FT4 | 2,8549 | 17,67 | 92,2957 |
| TT3 | 0,5196 | 3,21 | 16,7947 |
| FT3 | 0,8645 | 5,35 | 27,9446 |
| cT3 | 1917,2921 |
| 56908,1934 |
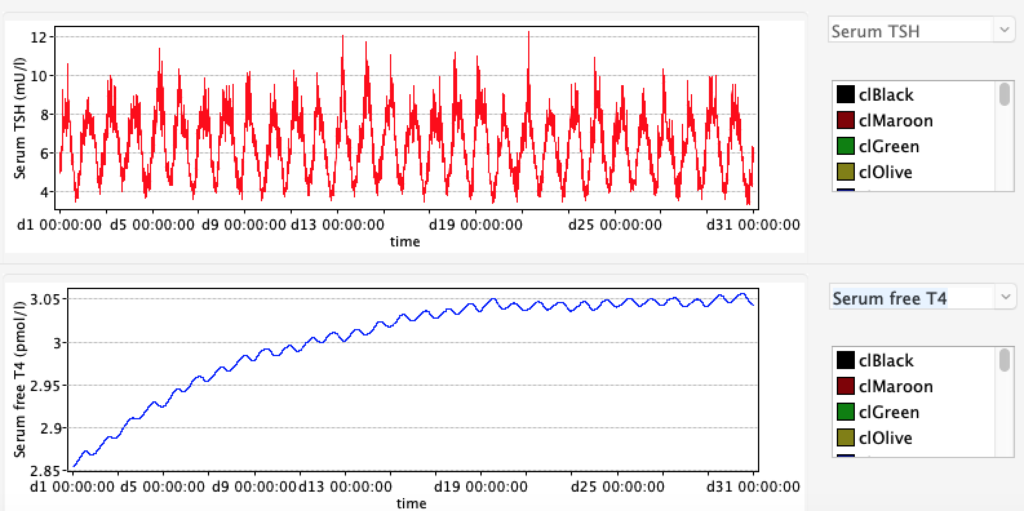
When the thyroid capacity is reduced we see changes in the thyroid hormones. Visualised below:

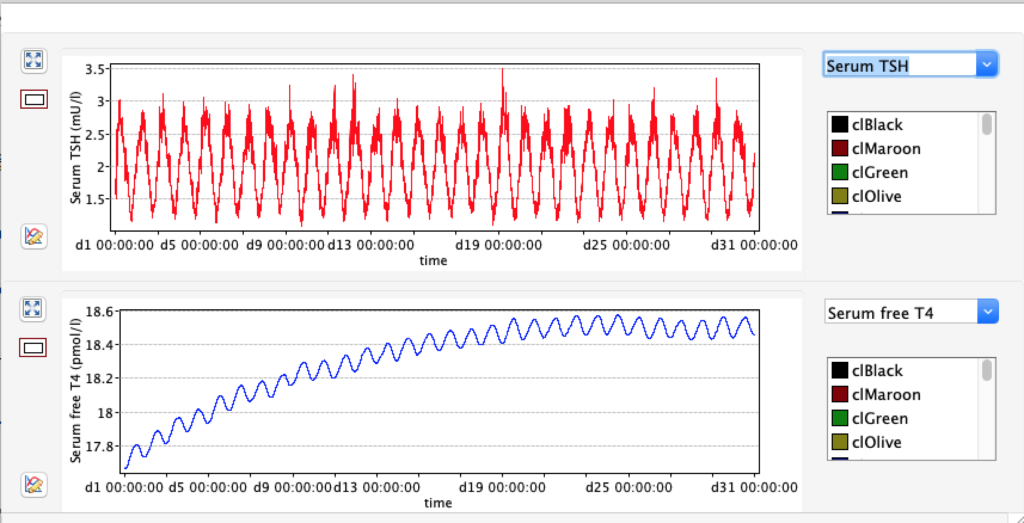
These are the standard curves:

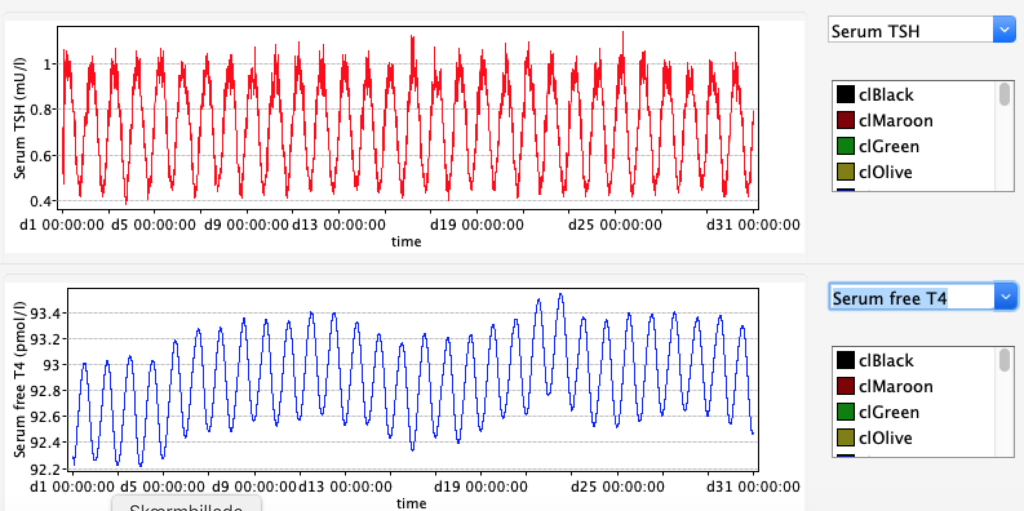
When the thyroid capacity is increased we see changes in the thyroid hormones. Visualised below:

Patterns of developing hypothyroidism or hyperthyroidism.